This story is part of a group of stories called

Uncovering and explaining how our digital world is changing — and changing us.
In the very, very old days, TV was simple. There were three channels, you sat on your couch, and you watched whatever they showed you.
That’s all different now, and much more complicated. Also more complicated: Figuring out which media or tech conglomerate owns the rights to the shows and movies you want to watch. We write about this stuff for a living, and we still get confused about it.
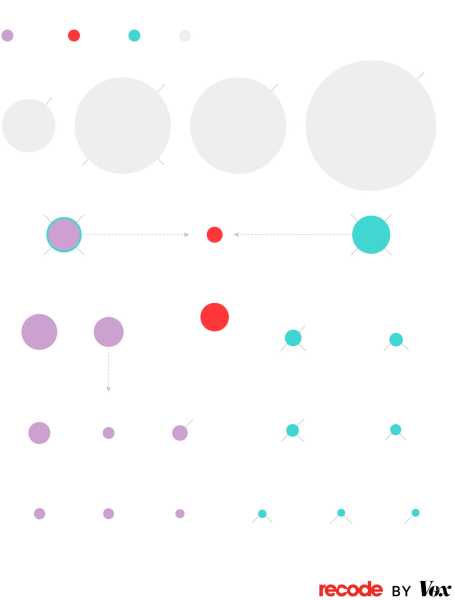
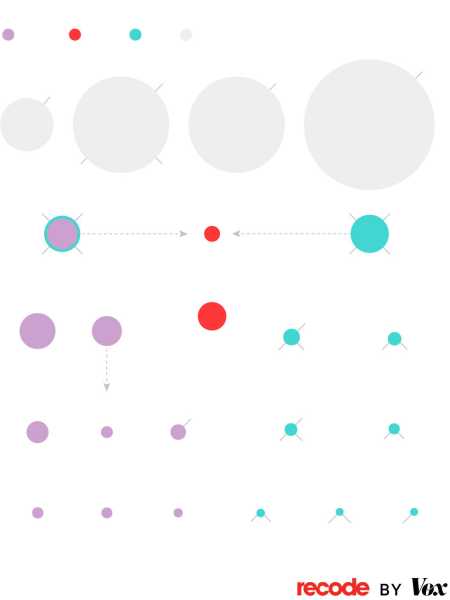
Which is why we’ve produced the map below, which sketches out the relative size, power, and relationships between the companies that make, own, and distribute the stuff we watch at home, on our phones, and even sometimes in a theater.
We’ve been making this one for four years. And each time we’ve created a new edition, we’ve promised that the map would continue changing, and it certainly has this time around.
Sign up for the newsletter Kafka on Media
Thanks for signing up!
Check your inbox for a welcome email.
Email (required)
Oops. Something went wrong. Please enter a valid email and try again.
By submitting your email, you agree to our Terms and Privacy Notice. You can opt out at any time. This site is protected by reCAPTCHA and the Google Privacy Policy and Terms of Service apply. Subscribe
But it hasn’t changed in exactly the way we would have imagined just a few years ago. Yes, media companies continue to merge with and absorb each other. But the main change is that Wall Street, which used to love Netflix, is now much more ambivalent about streaming, so Netflix’s value has dropped dramatically.
And every media company that has been chasing Netflix by trying to create its own high-growth, low/no-profit streaming service has seen its value fall as well. In 2016, for example, Time Warner was worth $85 billion plus debt to AT&T; now the company that used to be called Time Warner has been handed over to the Discovery cable networks, which has a combined value of only about $30 billion.
What do you think of Vox? Tell us!
We want to get to know you better — and learn what your needs are. Take Vox’s survey here.
The other major change is one we’ve made at the request of many of our readers, who rightfully argue that the giant tech platforms — Amazon, Apple, Facebook, and Google — are media companies. So we’re including them in this year’s edition, even though there are massive differences in the way those companies approach media. Amazon, for instance, treats media as a (very expensive) sidelight — a way to convince people to subscribe to its Prime shopping service. Meanwhile, YouTube is a key component of Google/Alphabet’s core advertising business. The main takeaway: These giants make the biggest media companies look tiny. (And yes, we should probably include TikTok next time.)
Our warning/advice/promise still holds, by the way: There will be more changes to come on this map, chiefly via consolidation. It is now conventional industry wisdom, for instance, to believe that Warner Bros. Discovery will end up combining with Comcast’s NBCUniversal in the next couple of years. And smaller players like AMC Networks and Paramount are constantly described as acquisition targets.
That said, it’s not entirely clear who would do the acquiring, given that any big tech acquisition of a major media outlet will draw lots of regulatory scrutiny. (It may be telling, for instance, that Amazon bought MGM — a media company that doesn’t own TV networks and has a low consumer profile. And the Biden administration still raised several eyebrows about that deal before letting it go through this year.) And combining two smaller media companies just gets you a … slightly bigger media company.
So yes, this map will change … somehow, sooner or later. We’re just done predicting how it’s going to change.

Media landscape
Distribution
Streaming
Content
Tech
Apple TV+
20-40M subs
Circles sized by market cap (September 2022)
MGM
YouTube
Reels
$392B
Amazon
$1.3T
$1.3T
Apple
$2.4T
Prime Video
Channels
Hulu
$27.5B†
NBC
Peacock
Disney+
ESPN
152M subs
13M subs
Comcast
$151B
Disney
$197B
67% stake
33% stake
46M subs
17M video
32M
broadband
CNBC
Universal
Studios
Marvel
Studios
Lucasfilm
Netflix
$106B
Verizon
$173B
AT&T
$118B
Warner Bros.
Discovery
$31B
Fox
$18B
Turner
(CNN,
TNT, TBS)
221M subs
Fox
News
Fox
broadcast
HBO, HBO Max,
Discovery+
92M subs
Food
Network
3.5M video
7M broadband
70% stake
Sony Pictures
$9.5B**
Paramount
$15B
Charter
$60B
DirecTV
$12B
Cox
$26B*
Axios
CBS
Columbia
Pictures
Sony
Pictures TV
Paramount+
43M subs
Showtime
15M video
30M broadband
14M video
3M video
5.5M broadband
Roku
$10B
Altice USA
$4B
Dish
$9B
AMC
$1B
Univision
$<1B
Lionsgate
$2.3B
60M active
accounts
10M video
(includes Sling)
2.5M video
4M broadband
IFC
Shudder
Univision News
Lionsgate
Films
Starz
†Minimum based on 2019 deal; *assumes 2X revenue multiple;
**assumes 1X revenue multiple
Source: The companies, news reports, Leichtman Research Group (cable/ internet subs),
Recode reporting

Media landscape
Distribution
Streaming
Content
Tech
Apple TV+
20-40M subs
Circles sized by market cap (September 2022)
MGM
YouTube
Reels
$392B
Amazon
$1.3T
$1.3T
Apple
$2.4T
Prime Video
Channels
Hulu
$27.5B†
Disney+
NBC
Peacock
ESPN
13M subs
152M subs
Comcast
$151B
Disney
$197B
33% stake
67% stake
46M subs
17M video
32M
broadband
Lucasfilm
CNBC
Universal
Studios
Marvel
Studios
Netflix
$106B
Warner Bros.
Discovery
$31B
AT&T
$118B
Verizon
$173B
Fox
$18B
Turner
(CNN,
TNT, TBS)
221M subs
Fox
News
Fox
broadcast
HBO, HBO Max,
Discovery+
92M subs
Food
Network
3.5M video
7M broadband
70% stake
Sony Pictures
$9.5B**
Paramount
$15B
Charter
$60B
DirecTV
$12B
Cox
$26B*
CBS
Axios
Columbia
Pictures
Sony
Pictures TV
Paramount+
43M subs
Showtime
14M video
15M video
30M broadband
3M video
5.5M broadband
Roku
$10B
Dish
$9B
Altice USA
$4B
AMC
$1B
Univision
$<1B
Lionsgate
$2.3B
60M active
accounts
10M video
(includes Sling)
2.5M video
4M broadband
Univision News
IFC
Shudder
Lionsgate
Films
Starz
†Minimum based on 2019 deal; *assumes 2X revenue multiple;
**assumes 1X revenue multiple
Source: The companies, news reports, Leichtman Research Group
(cable/ internet subs), Recode reporting

Media landscape
Distribution
Streaming
Content
Tech
Circles sized by market cap (September 2022)
Apple TV+
20-40M subs
MGM
YouTube
Reels
$392B
Amazon
$1.3T
$1.3T
Apple
$2.4T
Prime Video
Channels
Hulu
$27.5B†
Disney+
NBC
Peacock
ESPN
13M subs
152M subs
Comcast
$151B
Disney
$197B
33% stake
67% stake
46M subs
17M video
32M
broadband
CNBC
Universal
Studios
Marvel
Studios
Lucasfilm
Netflix
$106B
Warner Bros.
Discovery
$31B
AT&T
$118B
Verizon
$173B
Fox
$18B
Turner
(CNN,
TNT, TBS)
221M subs
Fox
News
Fox
broadcast
HBO, HBO Max,
Discovery+
92M subs
Food
Network
3.5M video
7M broadband
70% stake
Sony Pictures
$9.5B**
Paramount
$15B
Charter
$60B
DirecTV
$12B
Cox
$26B*
CBS
Axios
Columbia
Pictures
Sony
Pictures TV
Paramount+
43M subs
Showtime
14M video
15M video
30M broadband
3M video
5.5M broadband
Roku
$10B
Dish
$9B
Altice USA
$4B
AMC
$1B
Univision
$<1B
Lionsgate
$2.3B
60M active
accounts
10M video
(includes Sling)
2.5M video
4M broadband
Univision News
IFC
Shudder
Lionsgate
Films
Starz
†Minimum based on 2019 deal; *assumes 2X revenue multiple;
**assumes 1X revenue multiple
Source: The companies, news reports, Leichtman Research Group
(cable/ internet subs), Recode reporting
Our goal this month
Now is not the time for paywalls. Now is the time to point out what’s hidden in plain sight (for instance, the hundreds of election deniers on ballots across the country), clearly explain the answers to voters’ questions, and give people the tools they need to be active participants in America’s democracy. Reader gifts help keep our well-sourced, research-driven explanatory journalism free for everyone. By the end of September, we’re aiming to add 5,000 new financial contributors to our community of Vox supporters. Will you help us reach our goal by making a gift today?
Sourse: vox.com


