An October 6 column from mild-mannered New York Times columnist David Leonhardt carried the striking headline “The Rich Really Do Pay Lower Taxes Than You.”
And it was paired with an even more striking chart suggesting that the top 400 richest people in America pay a lower average tax rate than the middle class or the poor — and that this is a new phenomenon. The Times plotted a tax rate curve for every year from 1950 to 2018 (the interactive on their site lets you look through it year by year) and showed that while rates used to slope upward, they’re now largely flat until reaching the top 99.99 percent, after which they begin to plunge.

The analysis is based on a new book by French-born UC Berkeley economists Emmanuel Saez and Gabriel Zucman, The Triumph of Injustice: How the Rich Dodge Taxes and How to Make Them Pay. They want to make the rich pay by levying a wealth tax on large fortunes, exactly the approach now advocated by Elizabeth Warren and Bernie Sanders; Saez and Zucman worked as outside advisers to Warren when she crafted her wealth tax proposal.
Leonhardt presented the chart as simply based on “newly released data” from the book and dedicated the bulk of his column to addressing other issues posed by Saez and Zucman’s case for higher taxes on the rich. But the chart itself has touched off a weeks-long furor on economics Twitter plus an in-person debate including Saez, Zucman, and Larry Summers, a top economic adviser in both the Clinton and Obama administrations.
The duel over the chart is in part a technical battle, in part an ideological one, and in part a personality-focused clash about Warren. All the key participants in the fight are economists, and the battle is in part a fight about the economics profession and its role in the policymaking process — with traditionalists seeing Saez and Zucman as throwing professional good practice out to make a rhetorical point and Saez and Zucman seeing the profession as engaged in a process of mystification to serve the interests of the wealthy.
But beyond the specifics, the debate is also an object lesson in the annoying reality that the distinction between questions of facts and questions of values is not as clear in practice as one might like. Even a seemingly simple question like “how much do different people pay in taxes?” doesn’t have a clear-cut and unambiguous answer.
The mysteries of tax incidence
So how much do you pay in taxes?
This starts out looking like a simple question. You add up your income, then you add up how much tax you paid, and then you do a little division and you get a number. That’s easy enough to do for federal income and payroll taxes. And, indeed, the Congressional Budget Office regularly computes these numbers and invariably finds that the rich pay a higher share of their income in taxes. But that’s not the whole story. For one thing, you need to factor in state and local taxes, which tend to hit the middle class harder than the rich.
More importantly, though, you have to determine who really pays specific taxes, what economists call “tax incidence.”
Payroll taxes in the United States, for example, are levied half on employees and half on employers. A standard assumption in the economics literature is that even the taxes formally paid by employers in reality come out of workers’ wages. Sales taxes raise a similar question: Are they paid by customers or by vendors? And there is considerable controversy over who really pays the corporate income tax: shareholders, workers, customers, etc. Estate taxes, similarly, are formally paid by the estates of dead people, but to get a comprehensive view of the tax code, you need to assign them to someone who’s alive.
What’s more, for rich people there is some ambiguity as to how to think about income. For rhetorical purposes, at least, people sometimes talk about increases in share prices as if they are income — meaning Amazon CEO Jeff Bezos “makes” thousands of dollars per minute during times when the stock market is going up.
For tax purposes, however, these kinds of capital gains only count as income when stocks are actually sold and investment returns are realized.
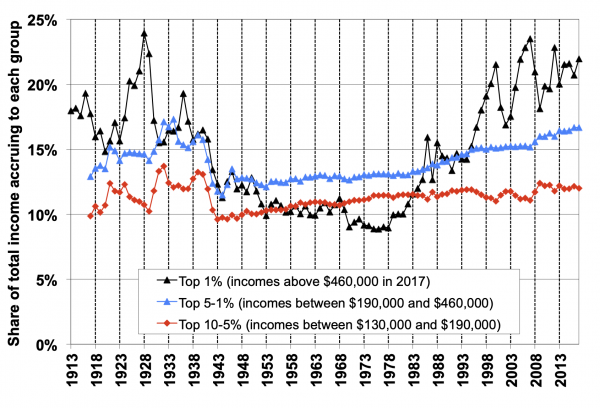
That’s why inequality charts that count capital gains as income, like this one from Saez, end up showing so much year-to-year instability in the earnings of the top one percent.

A further complicating factor are tax credits liked the Earned Income Tax Credit or the Child Tax Credit that are fully or partially refundable. The way a $100 tax credit works is that you calculate what you owe in income taxes and then subtract $100 from the figure — so the credit is a tax cut. But a refundable credit can reduce your tax liability to less than zero, in which case the IRS sends you a “refund” check.
This is a kludgy way to do policy, but Congress in its wisdom has chosen to use wholly or partially refundable credits as a means to help low-income families, and whether you count those refunds as “negative taxes” or government spending can change considerably how these charts look.
Last but by no means least, just as some taxes are levied on corporations, some income accrues to corporations and then just sits on their balance sheet as retained earnings. It’s normal to just ignore this, but for the sake of completeness, it would be better to consider it. Zucman and Saez do consider it and, in fact, make a whole series of contestable choices about these questions driven in part by an urge to completely account for all income in the economy.
A complete view of national income
Gross domestic product — the total of all the value of goods and services produced in a country, or the total value of all income earned in that country — is a critical economic statistic. So critical, in fact, that it’s conventional to say “the economy” grew 3 percent when we mean GDP grew 3 percent.
One project that Saez, Zucman, and Thomas Piketty have been involved with is an effort to develop distributive national accounts that would let us know whose income grew 3 percent when overall national income grew by 3 percent.
To make that comprehensive income accounting work, you need to attribute the retained corporate earnings to someone — so they add it to the incomes of the (mostly wealthy) people who own the corporations. You also need to make various choices about taxes. They follow the official GDP figures in construing refundable tax credits as government spending — equivalent to Medicare mailing a reimbursement to a doctor, Social Security sending a check to a retiree — rather than negative taxes. They say that employer-side payroll taxes are paid by workers, that retail sales taxes are paid by consumers, and in that paper they say that corporate income taxes are paid by owners of capital (except for housing).
These are all plausible ways of looking at the situation, but they all make important differences, and making different assumptions changes things. Saez and Zucman made one critical change in their model of how corporate taxes work between the publication of their national accounts paper with Piketty and the release of their book.
The headline fact rests on a bunch of assumptions
Treatment of the corporate income tax is particularly important for this exercise because Congress enacted a big corporate tax cut in 2017.
Prior to that, the Saez/Zucman data shows the top 400 taxpayers paying a lower overall tax rate than the top 0.01 percent or the top 0.1 percent, but a similar rate to the rest of the top 20 percent of the income distribution and a clearly higher rate than the bottom 80 percent.
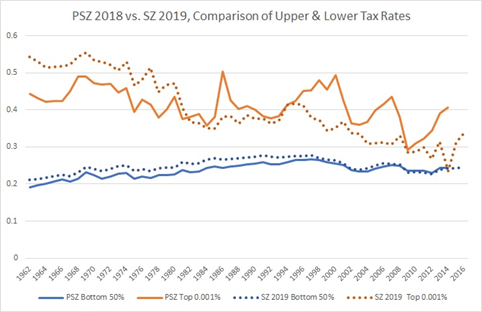
And this is important because, as first noted by libertarian economic historian Phil Magness, changing how corporate income taxes are handled makes a big difference in terms of assessing what rate the richest Americans are paying in taxes.
The solid orange line represents the tax rates estimated by Saez, Zucman, and Piketty’s scholarly article, using the assumption that the burden of the corporate income tax is spread across all non-housing capital (including small businesses and such), whereas the dotted line shows the Saez/Zucman book’s estimates based on the idea that corporate taxes are all paid by corporate shareholders.

Since ownership of corporations is very highly concentrated among the richest people, if you consider a corporate tax rate cut to be a pure tax cut for owners of tax-paying corporations, then you will get the conclusion that the Trump tax cut was an incredible windfall for the top 400 taxpayers.
On the right, it’s popular to argue the exact opposite of this: that the economic burden of the corporate income tax falls largely on workers and that Trump’s tax changes are a boon to wage growth. There are well-qualified people with a whole range of views about this, though as Saez and Zucman argue in their book, it does seem telling that rich people tend to lobby loudly for corporate income tax cuts and labor unions do not (if corporate tax cuts really do help workers, unions should be the biggest champions for corporate tax cuts).
In any case, the shocking new fact presented in Leonhardt’s column — that the very richest people pay a lower tax rate than the middle class — is not just a result of policy changes but a result of changes in how Saez and Zucman think we should understand the corporate income tax, changes from their own work just a year prior.
Beyond those modeling issues, the income estimate for the top 400 taxpayers is not a direct measurement; the tax data necessary to estimate their income after Trump’s tax cuts is not yet available from the IRS. Instead, Saez and Zucman write in a technical appendix that it “is based on triangulating publicly available sources and it could be refined in future work” and they offer various hopes that more precise estimation will be possible in the future.
To pile together several controversial assumptions, pair them with an uncertain estimate relating to the wealthiest people, compile that into a striking new fact that becomes the centerpiece of a media rollout aimed simultaneously at promoting a popular book and intervening in a presidential primary campaign — all this rubs academic instincts the wrong way and helps explain a fair amount of the scholarly backlash to Saez and Zucman.
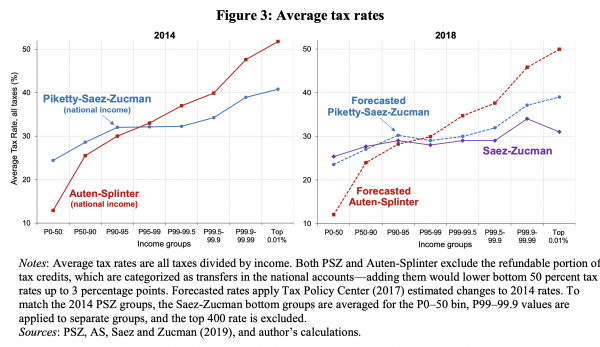
From a layperson’s perspective, perhaps the biggest thing you should know is the point Columbia University economist Wojciech Kopczuk makes in this slide from his presentation on the book: There are a lot of different ways to do these estimates, and they lead to very different conclusions. Work by Gerald Auten of the Treasury Department and David Splinter of Congress’s Joint Committee on Taxation, for example, has reached very different conclusions from the better-known Piketty/Saez/Zucman findings on taxes and inequality (primarily that the increase in inequality has been much less dramatic) and those findings themselves are different from what Saez and Zucman now say.

Government transfers are very important
Meanwhile, the reason this debate is interesting to regular people is that it’s relevant to contemporary politics. But in crucial ways it’s not clear that the fact (or perhaps fake fact) that played such a heavy role in the marketing of the book is all that relevant to policy. You could make the chart of rich people’s taxes over time look much “better” by adopting policies that progressives like Saez and Zucman would strongly oppose, which suggests the chart isn’t a great barometer for policy.
The payroll taxes that finance Social Security are flat for the first $132,900 that a person earns and then the rate drops to zero percent. What’s more, the tax falls only on wage income — exempting interests, dividends, capital gains, and other forms of income that are earned primarily by the wealthy. Rich people, in other words, uncontroversially pay a much lower share of their income in Social Security taxes than do working-class people. Consequently, if you completely eliminated Social Security, then the American tax code would end up looking more progressive.
This is not, however, a policy view that Saez and Zucman or any other progressive supports.
The main things they are trying to argue for are a crackdown on corporations’ use of tax avoidance and the creation of a new wealth tax. Those are ideas that, if implemented, would change the shape of the Saez/Zucman tax curve and make it clearly progressive. But the case for or against those ideas really stands or falls on issues that don’t have much to do with the chart.
Everything hinges on a big capital taxation debate
There are a lot of technical and practical differences between dividend and capital gains taxes, wealth taxes, estate taxes, and corporate income taxes, but they are all trying to tax capital, rather than labor or consumption.
Since ownership of capital is highly concentrated, capital taxation is a way of raising revenue from the people who will least miss the money. But there is a long tradition in economics of thinking that taxing capital is a bad idea, except perhaps as an emergency measure to finance a war or stave off an imminent government default crisis.
As with everything in economics, there are a lot of complicated arguments and mathematical models about this, but the basic idea is that financial capital is a representation of real things — office buildings, factories, machines, restaurants, inventions — that people use to do their jobs and create more value. If you tax capital, you’ll end up with less of that stuff, and the country as a whole will end up a lot poorer.
Zucman and Saez argue that for the purposes of drawing a chart about how much taxes people pay, this kind of secondary economic impact should be ignored — just as they ignore the fact that Social Security taxes fund useful benefits.
The key thing, however, is that Zucman and Saez also believe that the traditional argument against capital taxation is wrong. They argue in the book that “over the last hundred years, there is no observable correlation between capital taxation and capital accumulation” and that models positing big economic impacts of the kind of taxes they favor are ungrounded in empirical reality. Instead of taxes on the rich, they say, “the more important … forces are the regulations that affect private savings behavior.”
These assertions, rather than the chart that served as the anchor of the public debate, are in practice the key arguments of the book. If it’s true that higher taxes on capital significantly reduce economic growth and broadly impoverish everyone, as conservatives believe, then they’re probably a bad idea regardless of the impact on inequality.
But if that’s not true and we can finance lots of useful public services by taking money away from people who are indisputably very rich, then that’s probably a good idea, regardless of exactly how high a tax rate we think they’re already paying.
Sourse: vox.com


