
Manchester United host Manchester City at Old Trafford live on Sky Sports this Saturday – but how do the teams’ current styles and form compare ahead of the blockbuster clash?
Ole Gunnar Solskjaer was walking a thin line after the 5-0 defeat to Liverpool a fortnight ago but once again doused widespread calls for him to be sacked with a 3-0 win over Tottenham – but the pressure remains and the tension cranks even higher going into the derby at Old Trafford this weekend.
But the table fails to reflect the ongoing concerns about United’s wild form, with Solskjaer’s side sat merely three points shy of third-placed City in fifth spot. Indeed, there is a growing emphasis on Pep Guardiola to keep league leaders Chelsea within City’s sights after suffering their customary slow start to a campaign.
City could find themselves eight points adrift of Thomas Tuchel’s side – compounding the surprise 2-0 defeat to Crystal Palace last weekend – while Solskjaer is navigating a tricky run of fixtures to secure his future at the helm.


Manchester United
Manchester City
Saturday 6th November 11:30am Kick off 12:30pm


- Get Sky Sports
- Stream the biggest moments on NOW for just £25 p/m
- How to watch Manchester derby: Free highlights straight after FT
- Pep Guardiola: Now focus fully on Man Utd
Recent clashes certainly favour the hosts: City have failed to win a Manchester derby for two and half years in the Premier League – with United recording a commanding 6-1 aggregate scoreline since, from three wins and one goalless draw.
Trending
- Download Instructions
- Mexico City GP: When to watch it live on Sky
- Can Merc catch Max? Hamilton faces daunting Mexico mission
- ‘Nobody can stop me – no human can hurt me’
- Barcelona confirm Xavi as first-team coach
- Man Utd’s selection dilemmas ahead of crunch derby
- Napoli to wear Maradona tribute shirts in Serie A games
- PL predictions: Man City to breeze past Man Utd
- Canelo issues menacing warning at weigh-in
- FREE STREAM: Saudi Ladies International LIVE!
- Video
- Latest News
What’s the style?
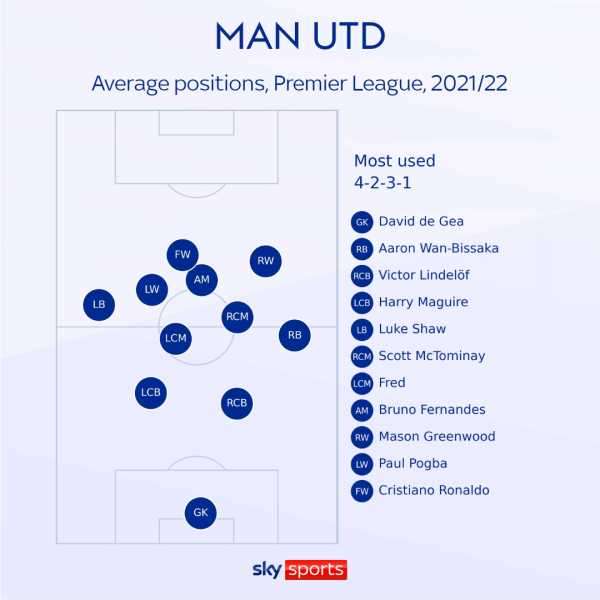
Solskjaer stuck with his favoured 4-2-3-1 formation during the first nine games of the season but switched to a 3-5-2 system after three defeats in four league games for the win over Spurs and deployed the same system for the first hour in the dramatic 2-2 draw with Atalanta in the Champions League.
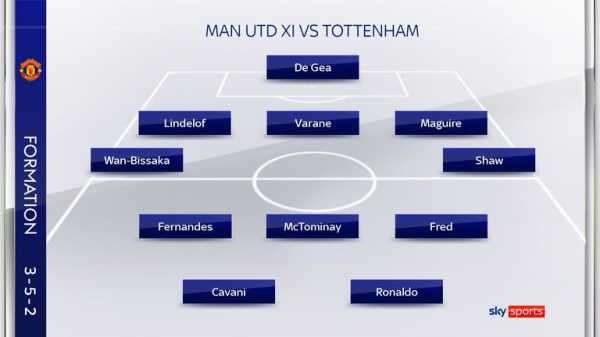
The average positions below reveal the full-backs typically play high up the pitch, with Scott McTominay and Fred shielding the defence and the wingers frequently moving infield.
Also See:
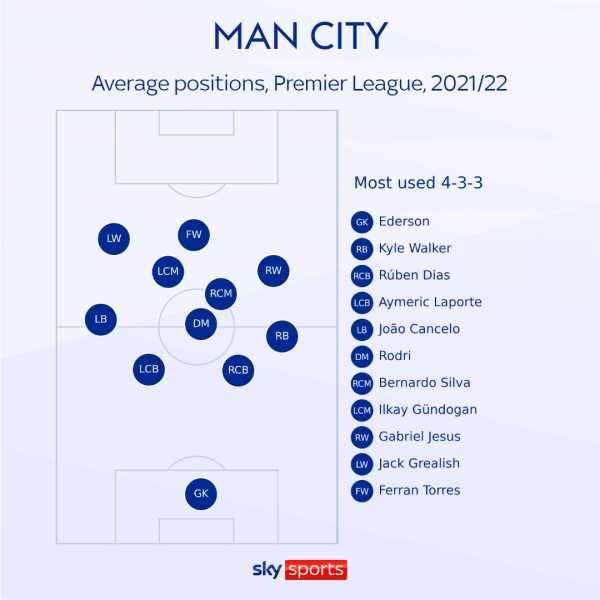
Guardiola has stuck with his favoured 4-3-3 system in each of the 10 league games this season, with the full-backs sitting slightly deeper than United – to allow Rodri to almost single-handedly protect the centre-backs.
Attacks analysed
City edge United by just one goal to date – but expected goals data reveals City have scored exactly what their xG value predicts, while United have outperformed their xG value by four goals – suggesting a clinical edge up top.
Interestingly, Solskjaer’s side surpass City for creating chances this term – registering four more assists and teeing up two more shots at goal. One area for improvement at United could be to utilise frequent crosses, with the team yet to score from a set-piece, corner of cross – primarily carving opportunities from central areas.
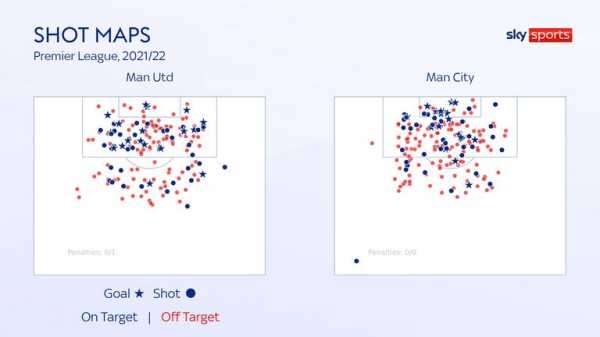
The shot maps below highlight United’s superior accuracy inside the opposition box and also their tendency to score from a greater array of angles and distances compared with their neighbours, with City missing a high proportion of attempts in the box and netting the majority of their goals from in and around six yards.
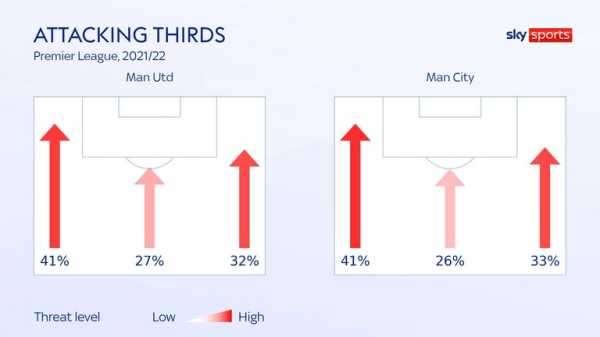
Another interesting correlation between the sides is how they attack in almost equal shares down the channels, both registering 41 per cent of threat down the left flank, compared with around 33 per cent down the right – areas marshalled by Jack Grealish, Joao Cancelo, Luke Shaw and Marcus Rashford.
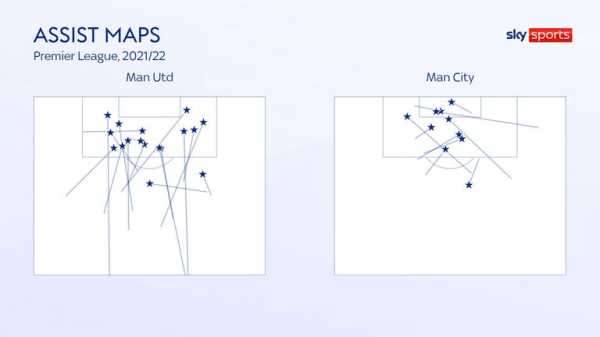
However, despite United’s threat primarily building down the left, the majority of their assists come from incisive passes in central areas, while the majority of City’s goals are created from slide-rule balls to onrushing runners.
The table below reveals United trio Cristiano Ronaldo, Bruno Fernandes and Mason Greenwood lead the way for goals with four each, while Phil Foden’s three-goal haul from just 465 minutes edges five team-mates on two goals.
Ronaldo matches his xG, suggesting the 36-year-old is eking out the greatest chances on goal and has converted exactly what the advanced metric predicts – while compatriot Fernandes has scored two goals more than expected.
In terms of assists, Paul Pogba leads the way with seven after a blistering start to the campaign but has hit a rough patch of form in recent weeks, while Fernandes leads by some distance for creating opportunities at goal. For City, Gabriel Jesus has teed up more goals than any other player.
- Paul Merson: Ronaldo phenomenal but result papers over cracks
- Download the Sky Sports Scores App: Apple | Android
- The UK’s No 1 scores app: Find out more
Clash of speeds
One polarised aspect of the teams’ styles is the speed at which they attack. As the interactive chart shows, only Aston Villa trump United for direct speed upfield per second with the ball, while City rank 17th with their patient, progressive style.
However, both teams are hugely successful at making progress into opposition territory in possession, with the average passing sequence – regardless of the speed of travel – pushing them around 17m closer towards goal.
In terms of productivity from breaking quickly, the reigning champions certainly have a counter in their locker – despite the tendency to build slowly – by matching United for direct attacks and shots from fast breaks.
In terms of the players, Grealish and Greenwood pose the greatest counter threat with three fast breaks, but Grealish has carried the ball a chart-topping 2.43km upfield – nearly twice the distance of his opposing compatriot from similar game time, which highlights the differing styles between the players.
Despite being 36 years of age, Ronaldo clocks the fourth fastest top speed from both teams at 34.2 km/h – behind team-mates Diogo Dalot, Greenwood and Aaron Wan-Bissaka – while Kyle Walker, unsurprisingly, registers the fastest speed at City.
The hard yards
Advanced metrics reveal United’s defensive line averages at around 43.6m from their own goal, slightly higher than City’s 42.8m – only Liverpool play a higher line with a strikingly advanced 45.2m.
So, both Manchester clubs compress opposition into tighter spaces and consequently cover less distance on the pitch. However, Guardiola’s side still rank eighth in the Premier League with 1,082km covered, while United rank 15th on 1,043km.
Meanwhile, United’s tendency to attack at pace rings true with 1,359 sprints this term, notably more than City’s 1,268 – with the clubs ranking sixth and 12th in this metric, respectively.
In terms of the players, there is no doubting Bernardo Silva’s commitment to the cause after rumours linked him with a move away from the Etihad this summer – registering a team-topping average of 11.1km per 90 minutes.
While Ronaldo defies his years in speed, Edinson Cavani matches that feat in exertion by recording a team-high 10.8km per game.
Passing analysed
City have recorded league-high numbers for average possession (63.7 per cent) and completed passes (5,542) this season. No surprises there.
However, the scale of their advanced distribution becomes clearer when looking at their leading margin for passes ending in the final third, while their tally of build-up attacks provides further evidence of their methodical approach to advance upfield.
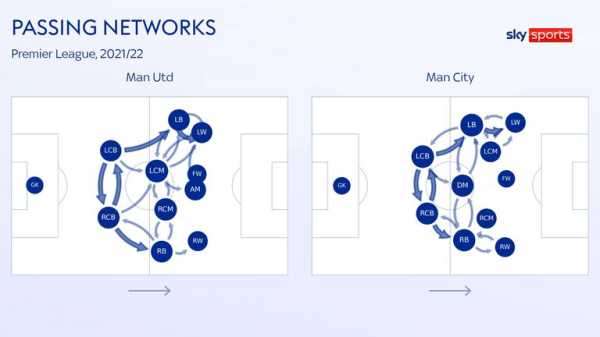
The passing networks below reveal common combinations between players, with Fernades almost dovetailing with the centre-forward for United, while City’s false nine typically uses movement to eke opportunities for himself and runners.
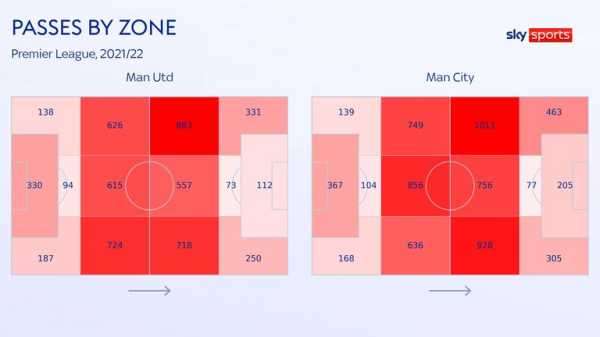
In terms of zonal passing, United record notable distribution down Wan-Bissaka’s flank in defensive areas and inside opposition territory down the left. City’s notable hot spots are in central areas just inside their own half and midway inside the opposition half, down the left channel – while recording a league-topping 205 passes in the penalty box.
Ruben Dias tops the Premier League with 656 completed passes this season, but unconventional full-back Cancelo stands out for registering only 10 fewer but with a vast proportion of those made in opposition territory – hitting a team-topping 61 passes into the penalty box.
City might look to nullify United’s key creator Fernandes, who has notched 90 passes into the box – some 30 more than any player at either club. Indeed, Atalanta man-marked the Portuguese in an attempt to diminish his influence.
Who presses hardest?
Pressing data is one of many new metrics deployed by data provider Opta and sheds light on how frequently teams and players press the opposition.
Using that data, the chart below ranks all Premier League teams for this season – placing City in 12th and United in 15th.
Many might expect City to rank among the elite in this metric – but the numbers are not adjusted for possession. With so much of the ball, City press less than a team who typically have an inferior share of the ball and also press frequently.
However, the numbers certainly emphasise how Arsenal and Chelsea are currently hunting in packs effectively.
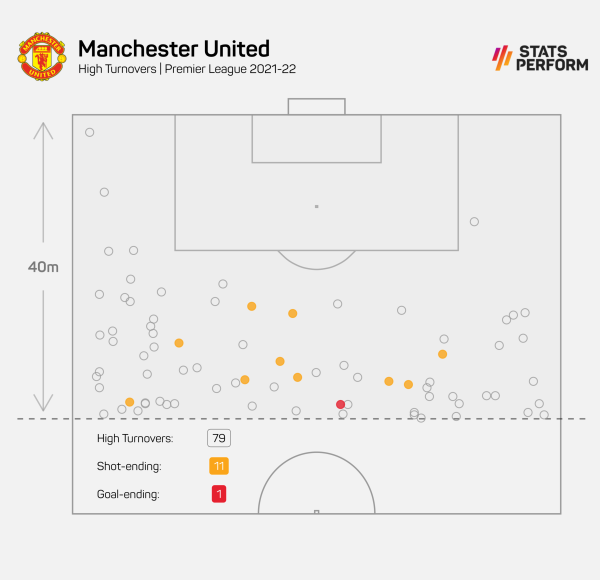
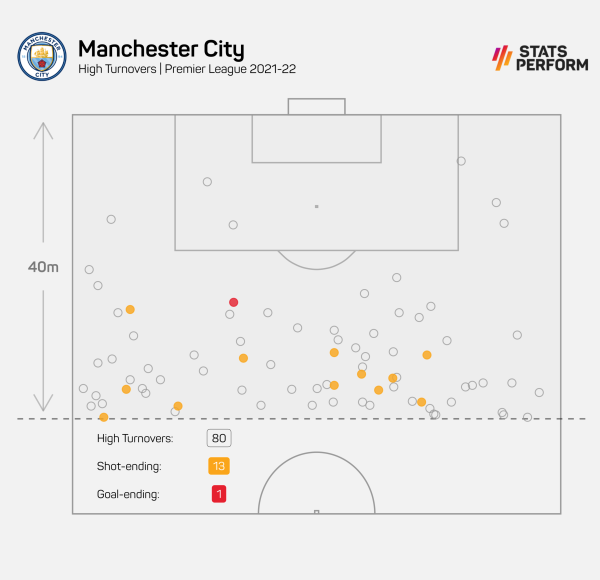
The two graphics below highlight a notable area of concern for United, winning far fewer ball recoveries and registering an area of permeability in central areas, just inside the opposition half.
In contrast, City protect this area expertly, to prevent turnovers and protect the high line from potential counter-attacks.
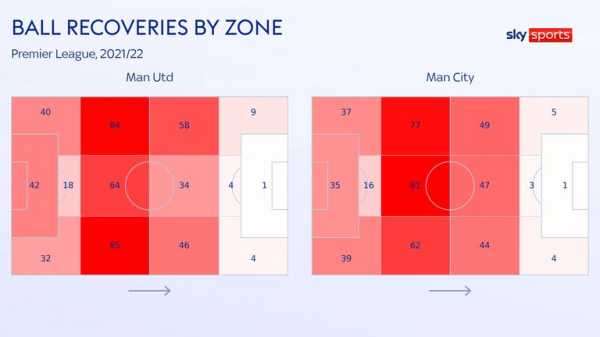
Both teams have won around 80 high turnovers this season and scored once after winning the ball back in these advanced areas. Both also tend to press hardest within a concentrated area, at around 20-40m from the opposition goal.
United press more down their left channel, while City are more evenly distributed across the width of the pitch.
United midfielder Fred records more pressures per game than any other player from the clubs, followed by Edinson Cavani – whose pressing abilities all over the pitch have been widely lauded over the past week.
Meanwhile, City’s pressing from the front is emphasised by the fact Foden, Silva, Jesus, Torres, Grealish, Kevin De Bruyne and Riyad Mahrez all out-press defensive midfielder Rodri.
- Live football on Sky Sports
- Premier League table | Fixtures
Soft spots?
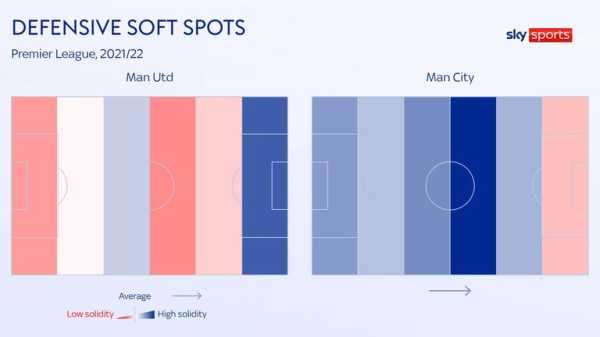
As highlighted above, United’s weakness through central areas is a notable vulnerability, which arguably has contributed to 15 goals conceded. Out of their ‘big six’ rivals, only Spurs have shipped more.
Injuries to Raphael Varane and Victor Lindelof will intensify concern for Solskjaer, but Eric Bailly impressed during the 2-2 midweek draw with Atalanta and looks likely to partner Maguire as a centre-back pair if Lindelof is unavailable on Saturday.
Conversely, City have remained consistently watertight for two seasons now and have conceded only six goals and kept six clean sheets this season – tallies bettered only by league-leaders Chelsea.
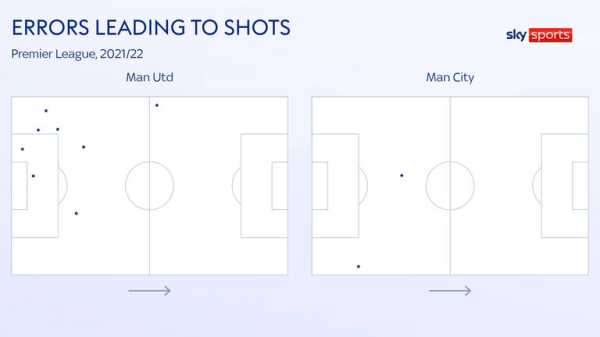
The interactive chart above reveals United have faced almost twice as many shots as their upcoming visitors, and errors have certainly contributed to that tally with a league-high eight mistakes leading to shots – typically occurring down the problematic left channel.
- Raphael Varane out for a month with hamstring injury
Harry Maguire has been culpable for three of those errors, but the graphic below reveals the centre-backs are frequently being drawn wider to cover the full-backs.
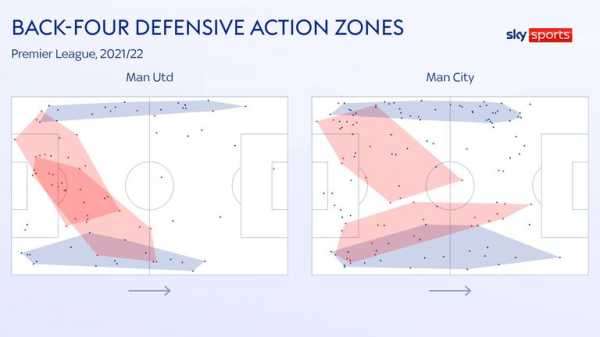
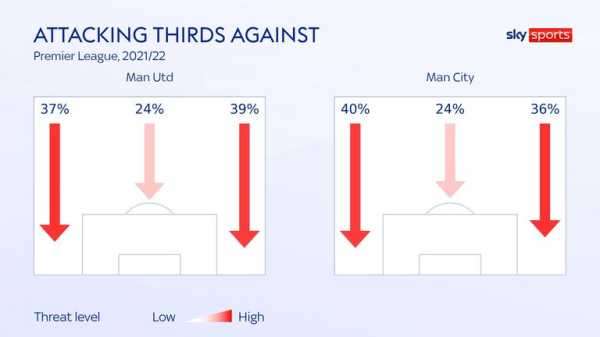
Despite Shaw’s tendency to play higher, teams facing United have actually attacked Wan-Bissaka’s flank more, on average – albeit only marginally. In contrast, teams typically look to expose City’s left-sided focus, by registering 40 per cent of attacks down that channel.
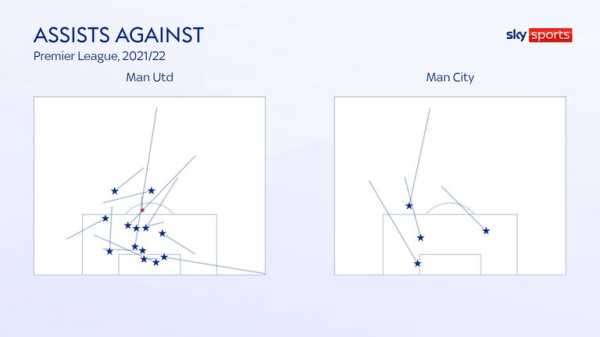
The assist maps below emphasise just how strong City have been defensively, with the majority of key passes fired through or over defensive lines from central areas, while United appear frail around the six-yard box and at blocking intricate passes inside their box.
Who’s red hot?
Foden is currently on the hottest streak of form, according to the Sky Sports Power Rankings – which measure 35 different matchday statistics according to starting position over the past five league fixtures.
In fact, only Fernandes punctuates a top six comprising solely of City stars, including Silva, De Bruyne, Cancelo and Jesus. However, Ronaldo’s recent exploits in Europe could set the stage for another moment of CR7 magic.
- How are the Power Rankings calculated?
- Premier League top scorers and assisters
In terms of form across the entire season to date, Fernandes and Cancelo have been the top performers, with Greenwood’s goal streak in August earning him third spot in the chart.
Now it’s your turn…
Use the interactive graphics below to explore team and player statistics in the Premier League this season…

Win £250,000 on Wednesday!
The Champions League returns, with the £250,000 Super 6 jackpot up for grabs. Play for free, entries by 7:45.
Sourse: skysports.com