Manchester City host Liverpool at the Etihad live on Sky Sports this Sunday in a crucial showdown in the Premier League title race – but how do the teams’ current styles and form compare ahead of the blockbuster clash?
England’s top two clubs in recent times face off in front of the Sky cameras with just one point dividing the teams at the summit, while recent clashes between them have typically been supercharged meetings.
- Get Sky Sports
- Stream the biggest moments on NOW for just £25 p/m
- How to watch Manchester derby: Free highlights straight after FT


Manchester City
Liverpool
Sunday 10th April 4:00pm Kick off 4:30pm


The table below lists previous meetings in all competitions since 2016/17 and highlights City’s recent dominance – with a 4-1 win in February last season and a 4-0 win in July last year. Liverpool edged a 4-3 thriller in January 2018 but City ran riot with a 5-0 masterclass in September 2017.
Which team is in better form?
Liverpool come into the fixture as the form team with 10 successive wins in the Premier League and having conceded only two goals in those games.
Trending
- Verstappen: ‘Unacceptable’ not to finish… ‘we’re miles behind’
- Papers: Arsenal and Spurs to compete for £60m Maddison
- Leclerc takes dominant Australia win as Verstappen DNFs again
- Ronaldo apologises after phone ‘outburst’ with fan in Everton loss
- Pep on his Man City evolution: I’m a completely different manager
- Transfer Centre: Gerrard planning summer shake-up at Villa?
- Smith closes within three of Scheffler at The Masters
- Australian GP recap: Leclerc wins after Verstappen woe
- Hits and misses: Knotweed back at Man Utd? Top four gone for Arsenal?
- The Masters: R4 tee times
- Video
- Latest News
City managed a run of 12 consecutive league wins until the streak ended with a 1-1 draw against Southampton in January, followed by a 3-2 defeat to Tottenham in February and a goalless stalemate at Crystal Palace last month – representing a wobble for Guardiola’s side.
As a result, the Reds have chipped away at the points’ deficit this year and slashed the gap from eight to a single point, and victory on Sunday would send Jurgen Klopp’s side to the league summit for the first time since September.
Also See:
What’s the style?
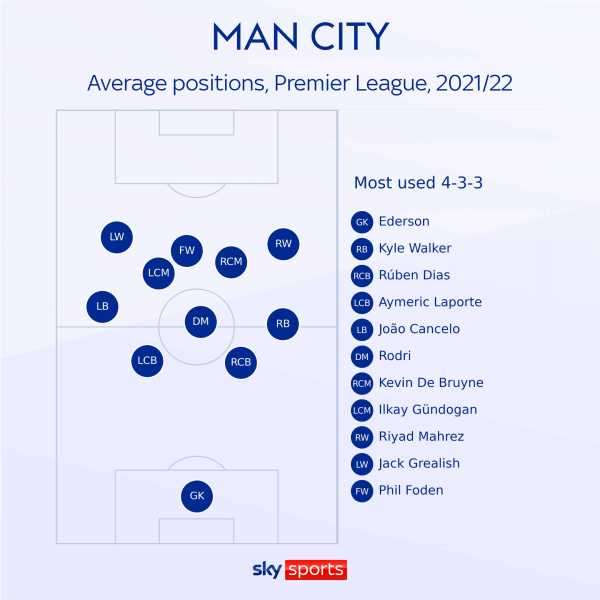
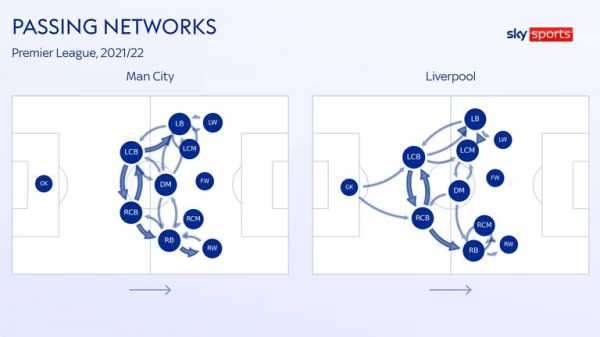
Manchester City have started 25 leagues games in a 4-3-3 system this season, with Guardiola opting for a 4-2-3-1 on five occasions. The average positions below present a pattern close to symmetry – but there is a slight attacking skew down the left flank.
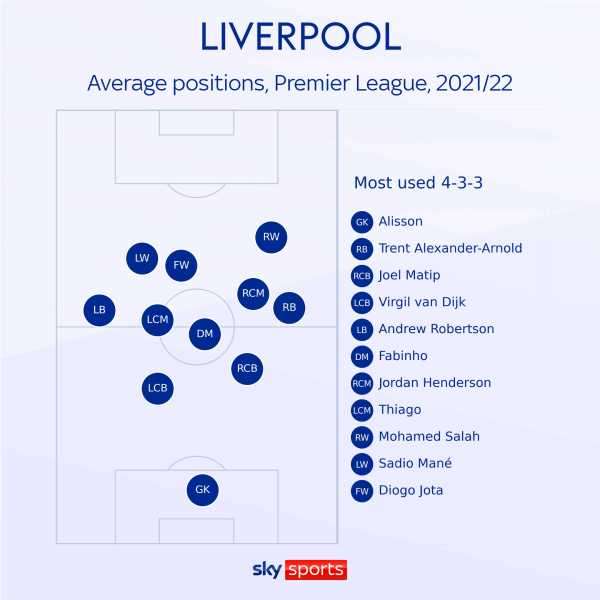
Liverpool typically overload the right flank with Trent Alexander-Arnold pushing slightly higher than counterpart Andy Robertson, although the Scot has been pushing further forward in recent weeks and new signing Luis Diaz has also begun to balance the left flank. Meanwhile, the right-sided midfielder edges wider and Mohamed Salah is stationed furthest upfield.
Attacks analysed
In addition to leading the table going into the weekend, the two teams also rank top across a raft of metrics. Despite City leading the way in the table, the Reds pave the way for goals, expected goals, shots, shots on target and assists.
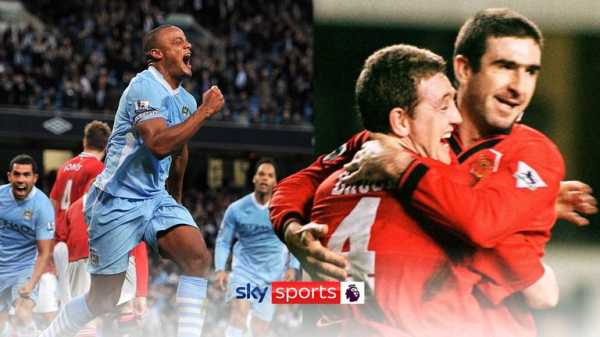
Ahead of Sunday’s crunch Premier League clash between Manchester City and Liverpool, check out some previous titanic title deciders
Both sides like to stretch teams with deliveries from wide areas and are virtually neck and neck for attempted crosses, but City have converted crosses into goals 13 times – three more than their upcoming visitors.
However, Liverpool reign supreme from dead-ball situations with a league-topping 22 goals from set-pieces – 12 from corners – and also pose considerable aerial threat with a league-topping 12 headed goals.
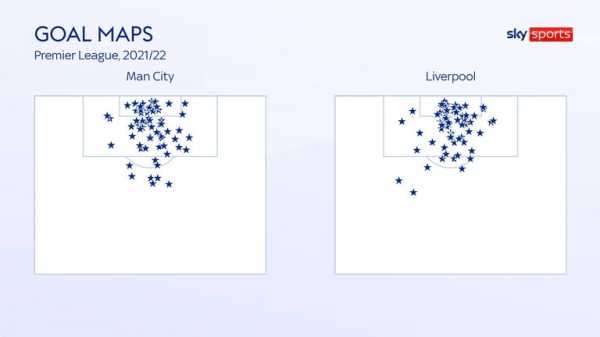
The goal maps below suggest Liverpool typically fire from a centralised band stretching from the goal-line to the penalty spot, in addition to activity around the right side of the six-yard box: Salah territory.
As was the case last season, City’s goals have primarily been scored from a cluster of shots taken in and around the six-yard box from customary runners and cut-backs.
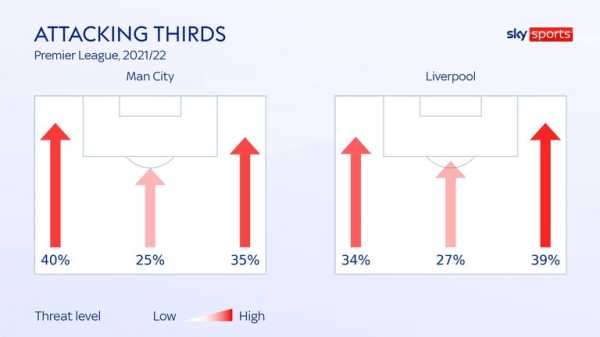
In terms of favoured attacking channels, the visualisation below reaffirms the styles revealed in the average positions, underlining how Liverpool carry their greatest threat down the right flank, while City match that danger down the left channel – which poses a fascinating conundrum for the managers when the channels clash head-on this weekend.
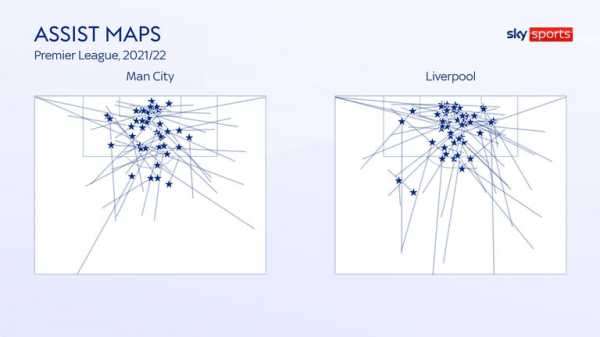
The majority of Liverpool’s assists from outside the box have come from the right flank or central regions. City appear to have also had the greatest joy from passes into the box from the right side, with shorter exchanges reaping rewards down the left – while Kevin De Bruyne provides a constant threat from central areas outside the box.
Liverpool trio Salah (20 goals), Diogo Jota (14 goals) and Sadio Mane (12 goals) top the goal chart for the teams combined, with expected-goals data suggesting Mane has spurned slightly more opportunities than his counterparts.
Football journalist Henry Winter praised Manchester City and Liverpool for the quality of this year’s Premier League title race
City quintet Raheem Sterling, Riyad Mahrez, Kevin De Bruyne (all 10 goals), Phil Foden and Bernardo Silva (both seven goals) pose the primary goal threats for Guardiola’s side.
Both sides will look to stifle the opposition’s key creators: Salah, Alexander-Arnold and Robertson are most dangerous for Liverpool, while De Bruyne, Silva and Jack Grealish are City’s primary creators.
- Download the Sky Sports App
- The UK’s No 1 scores app: Find out more
- The Premier League title race data
Clash of speeds
There are so many comparisons between the powerhouse teams but one notable difference is a contrast in approach, with City adopting a slower, more intricate and patient approach to build-up play.
Liverpool are typically more direct and the graphic below reveals only Watford have attempted more fast breaks this term, while only Leeds have recorded more ‘direct attacks’, which are defined as sequences that start inside the team’s half and have at least 50 per cent movement towards the opposition’s goal and end with a shot or touch in the box.
The key threats from counters? Unsurprisingly, Salah and Mane – but expect Diaz to begin creeping up the list below during the closing stages of the season. In terms of carrying the ball at feet, Silva and Joao Cancelo make notable inroads for City in advanced areas, while Joel Matip has increasingly made forays into opposition territory for the Reds.
Kyle Walker has registered the fastest top speed for City this season at 35.3 km/h but is likely to be on the wrong wing to cover Salah, who is the most rapid and prolific attacker on the pitch – clocking 36.6 km/h, in addition to his 10 fast breaks.
- Klopp: Beating City won’t decide the title
- Liverpool’s Quadruple bid: How do Klopp’s side fare in historic challenge?
- Man City vs Liverpool: Nev, Carra, Keane & Richards in studio
The hard yards
While both teams have eased off physically over recent seasons under their respective managers, City remain among the elite for distance covered – despite playing a notably high line with the lion’s share of possession, which would reduce the area to cover.

Wayne Rooney’s prediction on the outcome of the top-of-the-table clash between Manchester City and Liverpool seemed to please Jamie Carragher!
Only five clubs have covered more turf than Guardiola’s side in the Premier League this season, while Liverpool register league-average distances with 3,229 km covered to date – a far cry from their league-topping numbers during Klopp’s early years at the club.
City may cover more yards, but Liverpool register more bursts of acceleration with 4,210 sprints this season – some 339 more than their upcoming hosts and a reflection of the differing styles between the teams.
Additionally, that tally places the Reds third in the division for bursting from the blocks, but pales in comparison to Leeds’ league-topping 5,442 sprints to date.
Factoring players with 500 league minutes or more this term, City duo Bernardo Silva and Rodri cover the most ground out of the regular starters, while midfield counterparts Thiago and Jordan Henderson lead the way for Liverpool.
Robertson registers more sprints per 90 minutes than any other player among the two teams, with fellow full-back Walker and England team-mate Foden applying the afterburners most frequently for City.
- Man City fixtures | Liverpool fixtures
Passing analysed
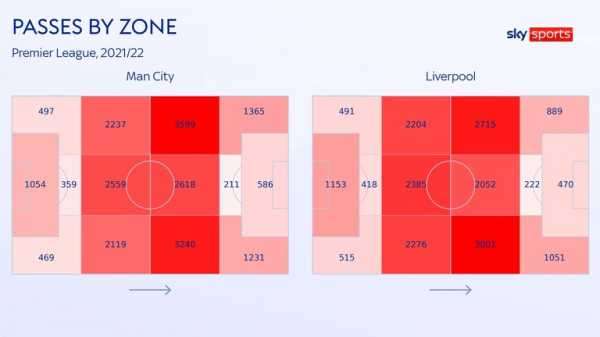
Guardiola’s side average at nearly 70 per cent possession, which is nothing short of staggering in a division packed with high-calibre opponents.
The numbers for build-up attacks and passing sequences in the graphic below reveal exactly how this share of the ball is achieved, with passing sequences defined as passages of play comprising of 10 or more passes in open play, and build-up attacks being those that resulted in a shot at goal.
Put simply, City are in another league when it comes to possession in the final third.
The graphic below reveals common passing exchanges between positions and further highlights Liverpool’s more direct style, with fewer combinations and a more direct route to goal when feeding the ball into wider areas.
The following graphic shows the full extent of City’s dominance in attacking areas, racking up 12,213 passes in the opposition half alone this term. For context, the likes of Norwich and Newcastle are close to 5,000.
Understandably, centre-backs dominate the passing metrics due to short exchanges in build-up play, but Rodri and Henderson emerge as the passing engines in the centre of the park, with Cancelo and Alexander-Arnold contributing heavily higher up the pitch from their respective flanks and moving infield.
The full extent of Alexander-Arnold’s influence at Liverpool becomes abundantly clear if you tap on the column for passes into the opposition box below, with nearly double the number of passes than any team-mate. De Bruyne and Cancelo primarily send searching balls into the box for City.
- CL hits and misses: Foden’s magic; Liverpool cruise
- De Bruyne gives Man City slender lead | Pep: Foden has special quality
- Diaz haunts Benfica as Liverpool win CL quarter-final first leg
Who presses hardest?
Both managers demand pressing to utilise high-line styles and defend the counter-attack. Advanced metrics suggest both teams hold the highest defensive lines in the divisions again this term – averaging at around 45m from their own goal – one of the reasons why this fixture can produce breathtaking showdowns when spaces are exploited.
Liverpool, once again, lead the way for high turnovers this season and are notably more aggressive than City in the attacking and middle thirds and will look to disrupt the hosts’ customary passing progression from deep.
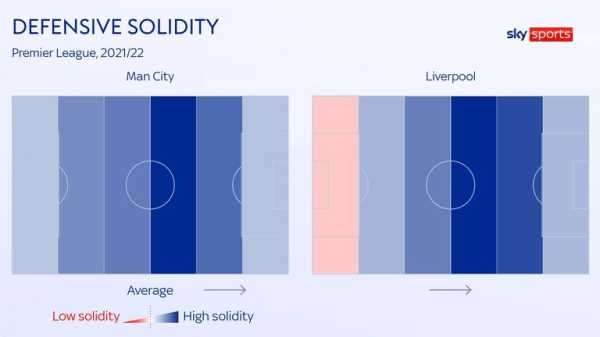
The graphic below reveals why both teams have shipped very few goals, registering unparalleled solidity ratings in the opposition half, while also providing evidence of the Reds’ narrow superiority in the final third but slight inferiority in their defensive third.
City defensive midfielder Rodri is the primary destroyer across the pitch, reclaiming possession 228 times, but a host of Liverpool players trail in his wake, including the likes of Alexander-Arnold, Virgil van Dijk, Henderson and Fabinho.
In terms of pressing from the front, Salah leads the way with 24 reclaims in the final third, with Rodri also producing team-topping numbers for this metric, but the numbers fall away marginally – providing further evidence of both sides’ high-press styles as team units.
- Live football on Sky Sports
- Premier League table | Fixtures
Soft spots?
While Liverpool edge City across attacking metrics, the reverse is true defensively. Guardiola’s side have recorded league-low numbers with only 18 goals conceded and 193 shots faced, including blocks – but both Ederson and compatriot Alisson are locked in the battle for the Golden Glove with a league-high 17 clean sheets.
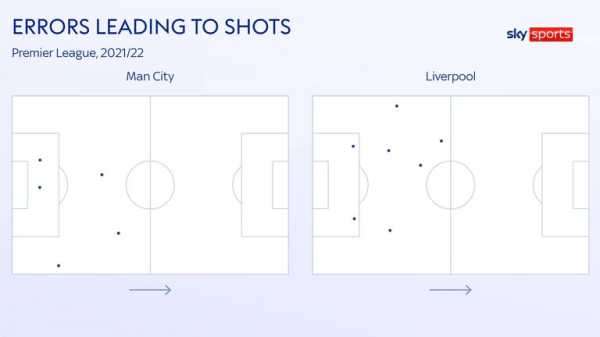
Only West Ham have made fewer errors leading to shots than City’s five to date, while Liverpool have made only seven. The location maps below indicate where these mistakes occurred and suggest, albeit barely significantly, City are more prone to errors in central areas, while Liverpool’s mishaps have primarily taken place down their left-hand third.
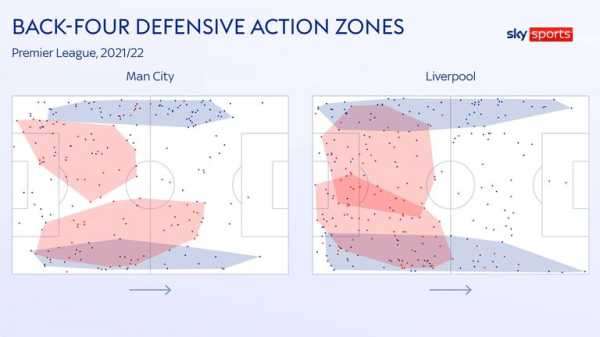
The graphic below reveals every defensive action made by the teams’ defenders this season and reveals Ruben Dias typically patrols a greater area of pitch at right centre-back, with Cancelo contributing a higher concentration of actions down the left flank than regular counterpart Walker down the right.
Liverpool’s dependence on Alexander-Arnold and Robertson is also shown by the pair’s defensive contributions down the entire span of their flanks, while Van Dijk and Matip typically patrol the width of their halves to help cover the adventurous full-backs and both push forward towards the halfway line.
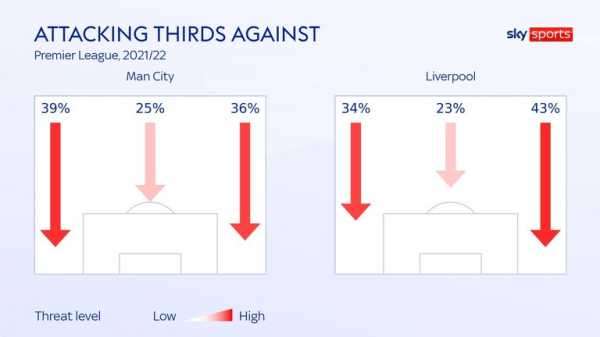
Opposition teams have attacked City’s more adventurous left flank most frequently, but by the finest of margins, amounting to 39 per cent of attacks faced, compared with 36 per cent down their right-hand third. In contrast, teams facing Liverpool have targeted the Reds’ advanced right channel, launching 43 per cent of attacks down that third.
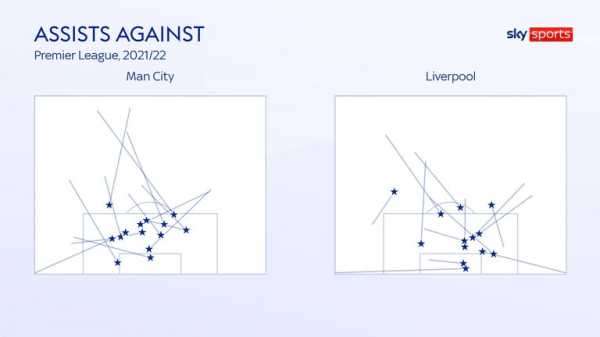
The graphic below shows the start point of every assist against the teams and reveals both sides have shipped very few goals from passes exchanged in their penalty areas – with almost all coming via passes launched from outside the box – so pinpoint precision crosses and through balls will be paramount on Sunday.
Who’s red hot?
Using the Power Rankings formula, which awards points to players for 35 different statistics – from goals and assists, to blocks and tackles, City captain De Bruyne is the most in-form player right now with four goal involvements in his past three league games.
Liverpool stopper Alisson is leading the way for Liverpool with five successive clean sheets in the Premier League, followed by Robertson – who now now has six assists in his past 10 league outings.
- How are the Power Rankings calculated?
- Premier League top scorers and assisters
- De Bruyne tops form chart ahead of Son, Alisson
In terms of the entire season to date, Salah and Alexander-Arnold are runaway leaders, with Cancelo and the resurgent De Bruyne in pursuit for City.
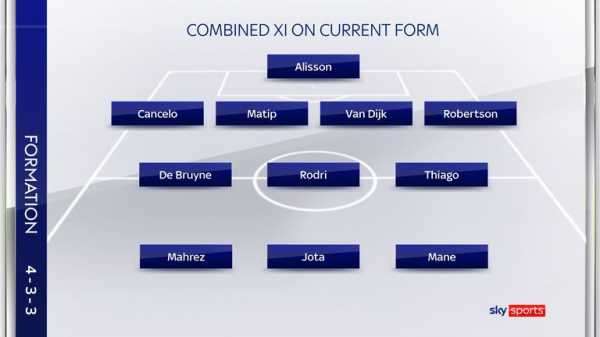
Image: Seven Liverpool players make the combined XI based on current form, according to the Sky Sports Power Rankings
Last time out…
The teams served up a Premier League classic at Anfield in October, as the defending champions twice battled back to draw 2-2 on an evening when momentum swung wildly between the two title rivals.
FREE TO WATCH: Highlights from the 2-2 draw between Liverpool and Manchester City in the Premier League
Last week…
FREE TO WATCH: Highlights from Manchester City’s win against Burnley
FREE TO WATCH: Highlights from Liverpool’s win against Watford
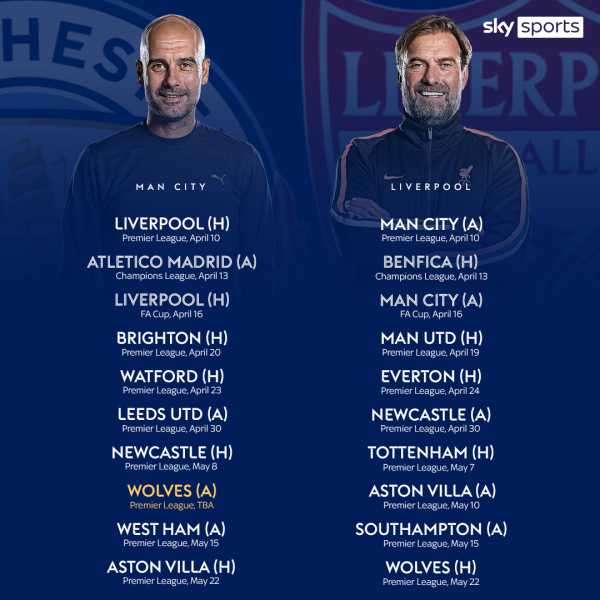
The run-in
Now it’s your turn…
Use the interactive graphics below to explore team and player statistics in the Premier League this season…
Pick your combined XI…
Use the team selector below to build your combined XI…

Win £250,000 on Wednesday!
The Champions League returns, with the £250,000 Super 6 jackpot up for grabs. Play for free, entries by 7:45.
Sourse: skysports.com