It’s been a wild ride for investors in the United States and worldwide in recent days.
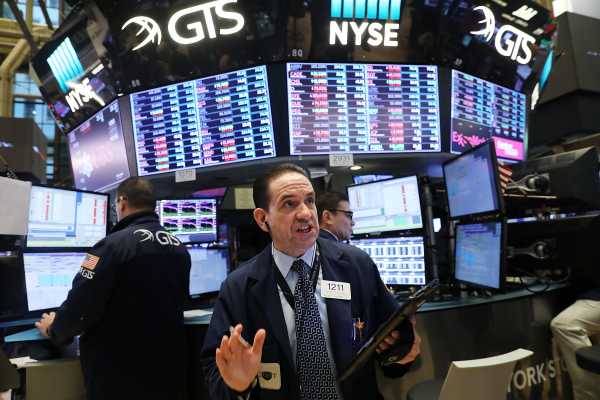
A market selloff that was sparked last week and accelerated on Monday hit the US and has sent ripples across global markets. The Dow Jones Industrial Average saw its biggest one-day point drop in history on Monday, and the S&P 500 had its worst day since 2011. Market volatility, which has been historically low in recent months, spiked, with the Cboe Volatility Index, commonly considered a gauge of investor fear, jumping by more than 100 percent.
Stocks in Europe and Asia subsequently tumbled, with Japan’s Nikkei Stock Average declining 4.7 percent on Tuesday, its biggest daily point drop since the UK Brexit vote in 2016, and Hong Kong’s Hang Seng seeing its biggest point decline since early 2008. The Stoxx Europe 600 and the UK’s FTSE 100 declined about 2 percent as well.
The Dow dropped more than 500 points at market open on Tuesday before recovering and briefly entering positive territory mid-morning. Major US equities indexes have continued to bounce, and there’s no sign of when market jitters will settle down.
“Don’t assume the worst is past,” Nick Colas, cofounder of Datatrek Research, a market insight and research firm in New York, wrote in a Tuesday note. “We remain positive on US stocks but recognize that viewpoint will likely leave some scar tissue once the current volatility has passed.”
In case you’re just tuning in to the current market rollercoaster, here’s a broad look at what’s going on, by the numbers:
1,175
The number of points the Dow Jones Industrial Average fell on Monday, February 5, its biggest one-day point drop ever. The previous record was a 777-point decline, set on September 29, 2008.
100 percent
The amount by which the Cboe Volatility Index, commonly considered a gauge of investor fear, increased on Monday, jumping from 18 at the start of the day to 37. It’s the index’s biggest ever one-day jump. Market volatility has been historically low for months, and there is speculation that products that bet against volatility are part of what spurred Monday’s meltdown.
4.1 percent
The amount by which the S&P 500 declined on Monday. The Dow fell by 4.6 percent, and the Nasdaq 3.8 percent.
2.71 percent
The yield on benchmark 10-year Treasury notes at the end of trading on Monday, down from 2.85 percent on Friday, the highest level since January 2014.
7 percent
How much the S&P 500 has to fall by in a single day before “circuit breakers” — or small pauses in trading regulators can impose to prevent a stock market crash from occurring.
10 percent
The amount an index such as the S&P 500, Dow, or Nasdaq would have to decline from its previous high to mark a stock market correction.
$4 trillion
The estimated amount global markets saw wiped away after reaching record highs in January.
1071
The number of points Japan’s Nikkei 225 fell on Tuesday, a 4.7 percent dip. That’s its steepest decline since Brexit. Hong Kong’s Hang Seng index fell by 5.1 percent, and the Stoxx Europe 600 and the UK’s FTSE 100 fell by about 2 percent.
18,332
Where the Dow closed on Election Day 2016, when Donald Trump was elected president. It closed Monday at 24,345.
$7,000
Approximately what Bitcoin, a sort of hyper-amplified symbol of investor exuberance, is worth. It was trading at more than $19,000 in December.
2.9 percent
Year-over-year wage growth in January, according to Friday’s jobs report. That signals a tightening labor market — and that increased inflation might be on the horizon. That could push the Federal Reserve to increase interest rates faster than anticipated, which is part of what is making United States stock investors nervous.
7 days
How long it’s been since President Trump bragged that the “stock market has smashed one record after another” at the State of the Union.
Sourse: vox.com


