Why it’s so hard to see into the future of Covid-19
The most difficult thing for an epidemiological model to predict: human behavior.
By
Brian Resnick@B_resnick
Updated
Apr 18, 2020, 8:29am EDT
Share this story
-
Share this on Facebook
-
Share this on Twitter
-
Share
All sharing options
Share
All sharing options for:
Why it’s so hard to see into the future of Covid-19
-
Reddit
-
Pocket
-
Flipboard
-
Email
One of the greatest challenges of the coronavirus pandemic is that all levels of policy makers need to make decisions with imperfect information. Scientists still don’t know everything about how this virus is transmitted, and due to the lack of widespread testing, they also don’t know, exactly, how prevalent it is. They don’t know if the virus will show a strong seasonal effect, and decrease during the summer. They don’t know how this will all end.
One way they are trying to answer these questions is through modeling. Specifically, infectious disease models are tools — based on mathematical formulations — that try to game out what’s possible in the future. These models are varied, often confusing to interpret, and are not crystal balls, especially because the ideal data isn’t yet available. But they are a large part of what government leaders use to make decisions, influencing how resources are allocated to health care facilities and how social distancing orders are issued to the public.
In this piece, I’m going to try to explain the utility of coronavirus models and how to think about them when you see them reported in the news. I’ll also explain a big idea to make these models work better in the future.
But before that, it’s key to stress what we don’t need them for. We don’t need them to know that we’re in a very, very dangerous situation.
“What’s very important is not the details of the model, it’s that this is a virus that can crush health care,” says Bill Hanage, an epidemiologist who studies infectious diseases at Harvard. “That’s not a model result, that’s an observation. We know it because of Wuhan, we know it because of Italy, because of Spain, we know it because, now, of New York.“
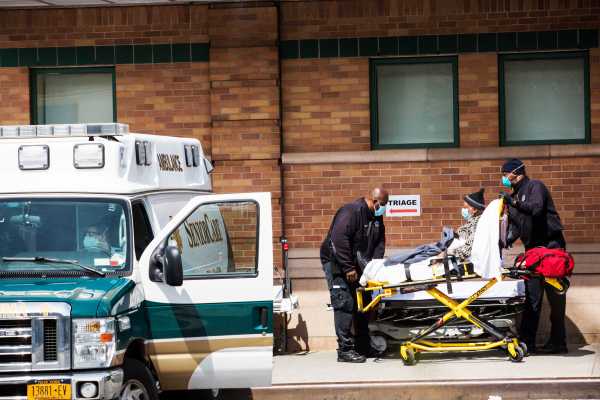
In New York state, thousands have died, and hospitals are at, or exceeding, capacity and struggling with equipment shortages. Covid-19 is “a freight train,” as Hanage calls it, and it has rammed into not just New York but several other parts of the United States.
Related
Why do some young, healthy people die from Covid-19?
But the models also suggest that the country is nearing, or has reached, the peak in daily deaths. In the next phase of the outbreak, the models, and decisions made with them, will be critical: Things might seem like they are getting better, and they may be in terms of new infections and deaths. But this freight train will just be paused. Without the right controls in place, it could start up again.
The models are not perfect: Some are even failing in their predictions (more on that below). More scientific oversight and analysis is needed to figure out which models are the most useful to use in decision making.
Still, modeling plays a very important role, and it can help the public know that they, are, in fact, doing the right thing by staying home. The point of these models is not to precisely predict the future, it’s to influence the future, and choose a good course of action.
Modeling an outbreak is an immense challenge
Leaders have tough choices to make in the weeks and months ahead, as the outbreak plays out differently in states. Models can help predict rates of new infections, and estimate when the strain on the hospital system could peak.
In early April, Washington, DC, Mayor Muriel Bowser said that modeling projects a surge in DC area hospitals during the summer. “Like all models, we hope this one will be proved wrong,” she told MSNBC. But she’s preparing for it anyway. “We are preparing for many people to come through our hospitals.”
A pandemic represents the mashup of some of the most complicated and messy things things we have ever tried to study: human behavior, virology, and the human immune system. Forecasting disease outbreaks is an immense challenge, and even the smartest minds here don’t have the answers as to how this all is going to end.
Models incorporate many different types of data into their projections. There are a head-spinning number of potential inputs. (And some models don’t use these inputs at all, but just rely on projecting data from earlier in the outbreak.)
A model can input the biology of the virus: How does it spread, how quickly does it infect, how quickly does it lead to symptoms, how quickly does it replicate to a level where it can jump from person to person? (Note: A lot of these variables are still not completely known.)
“What’s very important is not the details of the model, it’s that this is a virus that can crush health care”
It can account for human biology: How does the immune system mount a response to this virus, how many people will become immune after exposure, and for how long? Also, how many people can get infected with the virus, and have the ability to spread it, but never feel sick themselves? (A lot of this isn’t perfectly understood either.)
It also should, ideally, reflect how human society works: How many people do we come into contact with each day, and how does this vary in different communities, rural and urban? Models need to account for that; in a big country like the US, outbreaks are going to be regional, with varying intensities and responses.
It needs to be realistic about the capacities of health care systems: How many beds are available for Covid-19 patients, how quickly will they fill up, how many doctors and nurses are there to serve them, how many ventilators are there, and how many patients will need them, and when?
Then, there’s chaos: How do people react to the news that tens of thousands are dying from a virus that probably started with a bat, and how might that influence the model?
The question of “how will an outbreak progress” is clearly immense. In a common modeling approach called SIR (SIR stands for susceptible, infected, recovered), scientists are trying to figure how many people are susceptible to a disease, how many of them will become infected, at what rate and where. But then, as more people recover from the disease, and become immune, that decreases the number of those who are susceptible.
To sum up: This stuff is complicated! That we can get any insight into the future, considering the variables, is a miracle. Yet scientists are trying, and their efforts are valuable.
Hanage explains there are basically two main types of models being used to try to plot out the course of this pandemic: statistical models and mechanistic models.
Let’s start by explaining statistical models.
Statistical models try to predict the future by projecting current trends
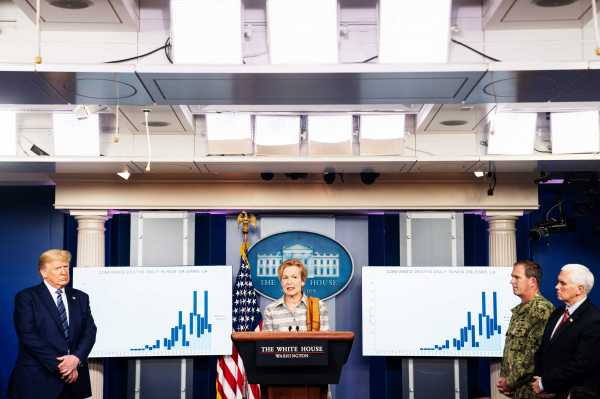
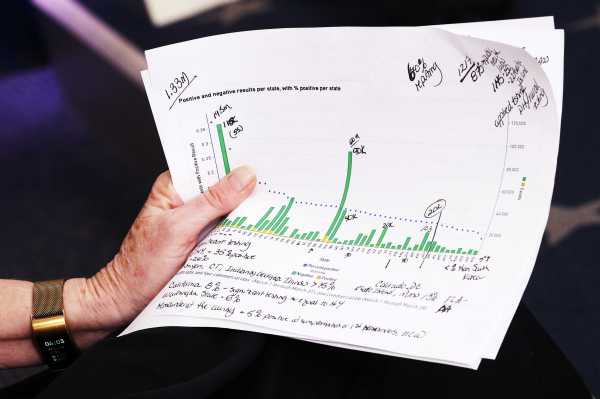
The Institute for Health Metrics and Evaluation (IHME) has the most commonly cited models — and it includes separate projections for every state. Dr. Deborah Birx, the White House coronavirus response coordinator, has referenced it. Hanage explains this model is what’s known as a statistical model.
The IHME, based at the University of Washington, looks at data of how Covid-19 outbreaks have progressed around the world. It takes that data and then tries to project what the epidemic curve will look like as new outbreaks form in new areas based on what social distancing actions are being taken. The goal is to predict the time of peak hospital strain in an area, and the number of deaths.
To use Hanage’s metaphor: It’s looking at how fast and hard the freight train has hit on other stops of its journey, and predicting it will hit that fast and hard when it gets to new stops.
This model makes some assumptions, namely, that the conditions for the previous freight train collisions will be similar in the future.
Earlier in the outbreak, the model was mainly fed from data in China, which imposed extreme social distancing measures. And so it assumes some high level of social distancing will continue into the future. “That makes this a best-case scenario model,” Carl Bergstrom, a computational biologist at the University of Washington, assessed on Twitter, at the end of March. It’s now also drawing from current social distancing actions in the US.
The IHME model assumes this behavior will continue. And its creators are transparent about this limitation. The projection, the IHME explains on its FAQ page, “only goes until the beginning of August and does not predict how many deaths there may be if social distancing is not fully implemented and maintained through the end of May, or if there is a resurgence after early August.” The hardest thing to model in all of this is not the virus, but human behavior.
Its performance has been inconsistent. Recently, a group of statisticians from Australia and the US took a careful look at modeling forecasts of the IHME.
In a preprint paper (that’s not yet been peer-reviewed), the statisticians found that the model — and specifically how its predictions on the number of daily Covid-19 deaths matched with reality — wasn’t making very good guesses when it came to individual states.
“It does well predicting what’s happening across the entire United States,” Sally Cripps, a statistician at the University of Sydney, who co-authored the analysis of the IHME model, says. It also seems to predict the outbreak in New York well. “What it doesn’t do well, is predict individuals states.” The model, she says, is “underestimating its uncertainty.”
The actual reported number of deaths in a state fell outside the model’s prediction between 43 and 73 percent of the time (depending on the date the model was assessed).
Which is to say: It isn’t very precise. The model was often more accurate predicting outcomes three days ahead than it was predicting events one day ahead, she says. Also, the analysis found some of the model’s predictions were underestimates, some were over. There was no clear pattern. Cripps says she fears this lack of precision “undermines the public’s confidence or trust in science,” and that she wouldn’t depend on the model for big policy decisions.
To be fair, deaths isn’t the only thing the model is trying to predict. It tries to gauge out when the pandemic will peak in a given area, and can help hospitals plan for that extra strain. Estimates of those peaks were not assessed in this paper — just the prediction of daily deaths were — and will have to be gauged after the peaks are met. The model could get the number of deaths wrong, but the timing of the peaks, right, for example.
(Yes, models are nuanced and confusing.)
Also confusing matters, the model has been updated several times, as its creators have input new data from new outbreaks, new social distancing measures, and new resources (like ventilators) that have become available. This has actually led the models to decrease their death toll projection for the US a few times, recently from 81,766 to 60,415, or about 25 percent. This doesn’t necessarily mean the model has been wrong. It means collective actions have been working.
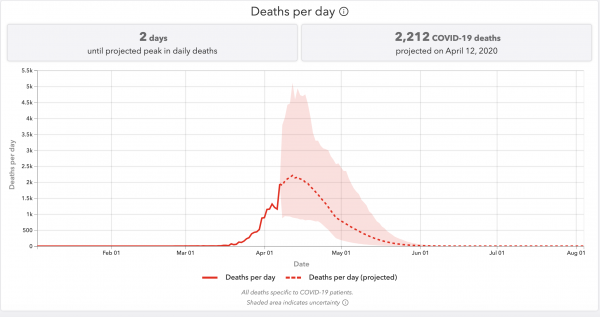
Also keep in mind: The IHME death toll projections come with a huge range of error. In the model, deaths per day are expected to peak soon in the US. As of April 10, it predicted the peak being two days away, and the error — the shaded area, was roughly 4,000 deaths per day.
“I think it’s key not to get fixated on the exact numbers,” Dominique Heinke, an epidemiologist in Massachusetts, says. “You can look at a range of models and say, we can expect it to be at least this bad.” Again, we know this: The freight train is coming, and in many places, is already here.
Why do these statistical models change so often?
Well, it reflects the complexity of the problem these models are trying to solve. For example, weather forecasters use atmospheric models to predict the weather, and as they gather more data on temperature, humidity, and barometric pressure, their forecasts become more accurate and, thus, often change.
“Unlike the weather, which we’re all accustomed to understanding and incorporating forecast into whatever decision you make, unlike the weather [here] we actually influence the outcome,” says Caitlin Rivers, a professor at the Johns Hopkins Center for Health Security. “So people see the numbers, and they are motivated then to be more aware, stay home, and using good hygiene and doing all the things that really change that outcome.”
The models change, because our actions change. The models could change for the worse if local governments declare premature victories and decrease social distancing measures too early.
“By keeping an eye on the model, we can tell how the virus is circulating in our own communities: in some places, cases and deaths are still going up, in some places they are starting to come down,” says Ali Mokdad, a professor at IHME and chief strategy officer for population health at the University of Washington. “We can also use the model to ask what businesses we should open first as we recover: The key issue as we go into recovery mode is to do it in stages so we don’t have a second wave of infections that will hurt us even more in terms of mortality and the economy.”
Unless testing can be scaled up, some social distancing measures may have to be kept in place until there is a vaccine available, which can take a year or more. What happens in the scenario when social distancing measures are relaxed, but then put in place again if cases spike again? “I’m not sure we can model that,” Hanage says.
Mechanistic models try to game out how the outbreak looks under different scenarios
The other type of model decision makers are using is a mechanistic model. These models are designed to help policymakers understand the impacts specific policies and actions may have on a disease’s course. These models also make a lot of assumptions, and often present very wide-ranging scenarios.
A good example of a mechanistic model comes from the Imperial College of London.
In the middle of March, it provided a scary wake-up call to the UK government to take more action. Their model looked at what would happen in Great Britain and in the US if the countries did nothing. It took what it knew about the transmissibility of the virus and put it into a model designed for the flu — a caveat right off the bat, as Covid-19 is not the flu.
(Transmissibility here is often called the R0, or R-naught; it’s the average number of new cases expected to be spawned by each case of an illness. Note: The value of the R0 is still just an estimation).
Related
Predictions are hard, especially about the coronavirus
In the scenario where nothing is done, the model’s authors found, there could be 510,000 deaths in Great Britain, and 2.2 million in the US. And that was “not accounting for the potential negative effects of health systems being overwhelmed on mortality,” the authors report.
That made headlines. But their model didn’t just report the worst-case scenario. It tried to gauge the impact of various social distancing policies, and tried to make estimates for many different R0 figures. The estimates ranged, for Great Britain, from just 5,600 deaths assuming a low R0 of 2, and the most aggressive social distancing, and 550,000 deaths assuming an R0 of 2.6 and no social distancing measures.
If you’re a leader of a country, looking at that spread, you know what you need to do: implement social distancing measures. That’s what the UK did. Later, when one of the model’s authors told the UK government in testimony that the deaths in Great Britain would probably number around 20,000, he was not revising the model, as some critics complained. Instead, he was reflecting that range of possibilities presented in the model.
Again, the point of these models is not precise prediction, it’s to influence action.
That’s helpful. But again, as with the statistical models, these mechanistic models can’t game out every possible future.
Recently, Columbia University put out a model (with a handy interactive map) that tries to predict which US counties will have their health care systems overwhelmed, under different social distancing scenarios, and when.
The model also attempts to help hospitals by showing how different coping strategies in hospitals (i.e. converting operating room beds to Covid-19 care beds, for one example, and modifying ventilators for use in multiple patients for another) could mitigate the problem, and help save lives.
The prediction is grim for the crush on hospital systems, which is expected to soon move from the northeast United States, to Southern states, as the outbreak starts to impact more and more rural areas. (Keep in mind: As outbreaks in some cities taper off, outbreaks in other areas may just be getting started.)
It’s a complicated model. It’s trying to predict hospital bed demand, ICU bed demand, and ventilator demand, Jeff Shaman, an infectious disease modeler at Columbia, explains. “It’s a mathematical description of transmission at county scale, where the counties are linked by movement between them based on … travel patterns, and understanding that those have waned over time because of this ongoing Covid crisis.”
Related
Experts predict American hospital staffing will “spiral” as doctors fall ill to coronavirus
It tries to account for a lot, but it can’t account for everything. Something it can’t account for: the possibility that health care workers get sick and have to leave work, leaving these hospital systems more strained. “We’re in the process right now on establishing a national database on staffing levels,” Charles Branas, chair of epidemiology at Columbia, says. “It’s been challenging to build this airplane while it is flying, quite frankly.”
That doesn’t mean the model is useless. It can still help guide decision-making. You can look at the map and see which counties are still overwhelmed in their best-case scenarios. “Those could potentially be first-choice counties for supplementary resources,” Branas says.
I asked the Columbia researchers how they’d like the public to think of their model.
“These are not forecasts, they are projections, we’re dealing with a very, very uncertain environment,” Shaman stressed. “The degree to which people are social distancing … is changing day-to-day. It is difficult to pin down what’s going on. We’re making multiple projections because we don’t know what people will do. We do it because we would like some window into the future. So we can assess: Are we on a really bad trajectory no matter what we do? Or are we on a good trajectory no matter what we do? Or is it incumbent upon us to make certain decisions so we can more certainly move to a better outcome?“
(Another mechanistic model to check out: The University of Pennsylvania has a tool for regional leaders to input their own observations, and see how an outbreak might impact their area’s hospitals.)
What we need in the future is better disease forecasting
There’s a lot that’s still unknown about the coronavirus, and the pandemic.
“There will be people writing papers 100 years from now about what actually happened, there will be people making discoveries about the relative rates of increase in San Francisco vs. New York,” Hanage says.
Rivers, the Johns Hopkins epidemiologist, hopes, in the future, we’ll get better at this. Like the US has the National Weather Service — a government agency staffed to create weather models and test their predictive power — she hopes to see the creation of a National Infectious Disease Forecasting Center.
“The reason that we have accurate weather forecast today, is because there was a federal agency responsible for weather forecast,” she says.
We need to learn from the modeling approaches being used now, to make better models for the future. The weather service does this for hurricanes: You can clearly see in the weather service data how hurricane forecast tracks (i.e. forecast models) have greatly improved over time. Rivers doesn’t see that as an accident. The weather models have improved because there’s a centralized service to study and create them.
She says there needs to be some central agency collecting these models in an archive, so that researchers later on can figure out which ones worked the best, and why. It could then incorporate that understanding to better forecast future outbreaks.
“The point of these models is not to precisely predict the future, it’s to influence the future, and choose a good course of action”
Right now, there are a lot of models. There are a lot of projections. We’re not sure which ones will be most accurate, or useful. “Don’t end up being obsessed with a specific number,” Hanage gives a final piece of advice. “Just end up recognizing the number is large. That’s the best way to think about it.”
Hanage offers another potentially helpful metaphor: “A very, very good physicist will be able to model what will happen if you walk out into the interstate and say exactly where your body parts might land, but the fact that another model puts the body parts in another place, doesn’t alter the central conclusion that you’re going to get run down by a car,” he says.
For now, the biggest message from all of them is that social distancing measures are indeed saving lives. The models predicted that weeks ago — and that prediction is coming true. We can all feel good about our sacrifices because of that.
Support Vox’s explanatory journalism
Every day at Vox, we aim to answer your most important questions and provide you, and our audience around the world, with information that has the power to save lives. Our mission has never been more vital than it is in this moment: to empower you through understanding. Vox’s work is reaching more people than ever, but our distinctive brand of explanatory journalism takes resources — particularly during a pandemic and an economic downturn. Your financial contribution will not constitute a donation, but it will enable our staff to continue to offer free articles, videos, and podcasts at the quality and volume that this moment requires. Please consider making a contribution to Vox today.
Sourse: vox.com