
This story is part of a group of stories called

Uncovering and explaining how our digital world is changing — and changing us.
Over the weekend, Instagram co-founders Kevin Systrom and Mike Krieger launched rt.live, a website that calculates how fast the coronavirus is spreading in each state. This might seem like a surprising move for two people who became rich and famous for building a photo-sharing app. Then again, they also know a thing or two about metrics and algorithms.
While the numbers of cases and deaths are important metrics, these figures lag behind the present situation since it takes a while before symptoms show and people are tested. That’s why Systrom and Krieger zeroed in on a different metric: the effective reproduction rate (Rt) of Covid-19. Their new site presents this Rt metric in a series of charts showing how the spread of coronavirus in the United States shifts over time.
You might be more familiar with the basic reproduction number (R0), which represents the number of infections caused by a single infection of a given disease. Rt, which is sometimes referred to as Re, uses statistical adjustments to create a more real-time and dynamic estimate of how fast the disease is spreading. Plotted out over the past few weeks, the Rt metrics of every state in the country can show the spread of the novel coronavirus being affected by government actions like stay-at-home measures.
“I was thinking about the metric I’d need to make decisions during times of uncertainty and this seemed like the right fit,” Systrom told Recode.
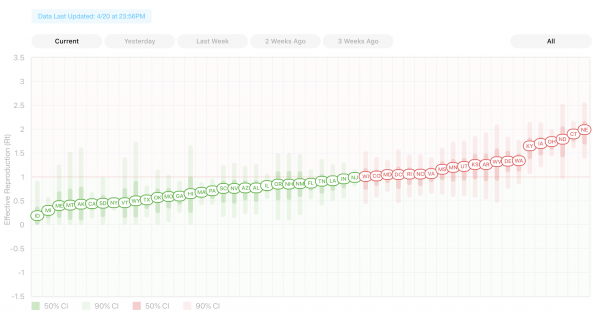
An Rt value of one means each case causes one new case, on average. If the value is less than one, the spread of the disease is slowing and will likely peter out over time. A value higher than one means it will spread to more and more of the population, so the higher the value, the worse the spread.
Even a quick glance at the Rt values shows stark differences across the United States. As of April 20, Nebraska had the highest effective reproduction rate of any state with each individual leading to an average of two secondary cases. Idaho had the lowest Rt at 0.2.
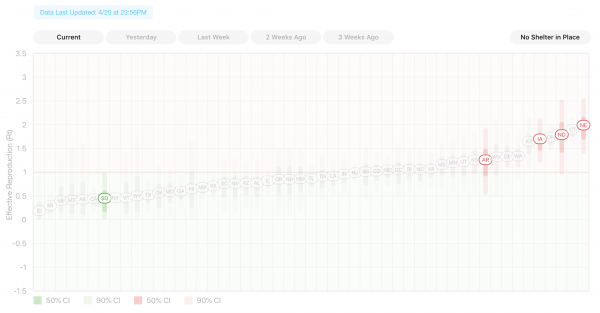
Another view of the same chart highlights states that do not have shelter-in-place orders. Four of the five states without those orders — Nebraska, North Dakota, Iowa, and Arkansas — have high effective reproduction rates, suggesting the virus spreads more quickly in areas where shelter-in-place orders don’t exist.
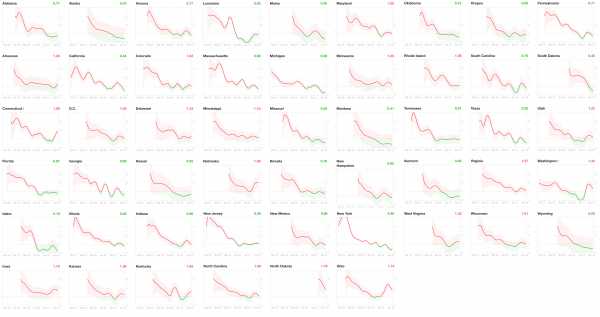
As the state-by-state charts below make clear, the effective reproduction rate fluctuates over time. These fluctuations reflect how different behaviors combined with the disease’s inherent characteristics can slow the spread of Covid-19 — or speed up the outbreak.
In New York, for example, the Rt has been declining since March 22, when the state issued a stay-at-home order. In the last couple of weeks, it has been below one, and if that Rt value holds the disease could die out there over time.
The situation is much different in Nebraska and Iowa, where there is no stay-at-home mandate. The Rt value in those two states has been consistently above one, meaning that the disease is likely to keep spreading. Generally speaking, states that have enacted strict measures against the spread of coronavirus are showing the Rt trending downward, and those without those orders are fluctuating more sporadically.
These graphs tell a different story than even advanced state-by-state breakdowns of Covid-19 cases. And echoing Systrom’s own statements, epidemiological experts are also in favor of better metrics to fight the pandemic.
“Policy must not be determined based on the daily count of reported cases — the tallies you read about constantly in the news — because those are unreliable,” Gabriel Leung, an infectious disease epidemiologist and dean of medicine at the University of Hong Kong, wrote in the New York Times earlier this month. “What’s needed instead is the coronavirus’s real-time, effective reproduction number, or its actual ability to spread at a particular time.”
Natalie E. Dean, an assistant professor of biostatistics at the University of Florida, said in an interview that Systrom and Krieger’s model, as well as the data behind it, seems sound. (The Rt on Systrom and Krieger’s site is calculated using a moving average of new case data from the nonprofit Covid Tracking Project and by applying a modified formula created by scientists Luís M. A. Bettencourt and Ruy M. Ribeiro.) Tracking the effective reproductive rate of the virus, she added, is a reasonable way to look at how well states’ intervention strategies are working. However, Dean warns that, on its own, a low Rt is not a good reason to end shelter-in-place measures.
“If people are using it for permission to open things back up, it’s not the full story because there are other considerations, like what systems do you have in place to prevent this from shooting back up again,” Dean said. “If you just open everything back up but are not testing widely, isolating cases, and contact tracing, it’s just going to shoot back up.”
Nevertheless, it’s not yet clear how Systrom and Krieger’s site will factor in to public health decisions. The site cites some known issues with the data, including how quick ramp-ups or declines in testing could affect the numbers. There’s also the delay between when someone is infected and when they begin exhibiting symptoms and get tested. Other issues include low testing levels in some states as well as the fact that many people are asymptomatic and may never get tested. If a testing level hits a ceiling, for example, Dean said it could show the same number of new cases per day and the same Rt even if cases are growing rapidly.
Systrom, for one, seems committed to spending time helping solve pandemic-related problems. The Instagram co-founder has already written a series of blog posts about the coronavirus response, including one called “The Metric We Need to Manage COVID-19” that preceded the launch of rt.live. He’s also conversing with scientists and statisticians — as well as people on Twitter — about how to improve it and what features to add.
“Without the use of a clear metric on our ability to contain the coronavirus pandemic, it’s difficult to imagine that we’ll manage a return to normalcy anytime soon,” Systrom said in his latest post. “I hope by sharing this work with you, you will consider Rt as the metric that can guide our analysis and decision-making.”
For Systrom, the project is currently “full time in the sense that we’re all in lockdown and I’m not working on any other major projects at the moment, but I don’t intend on it being a job.” He added, “Think of it as a collaboration between me and Mike.”
Support Vox’s explanatory journalism
Every day at Vox, we aim to answer your most important questions and provide you, and our audience around the world, with information that has the power to save lives. Our mission has never been more vital than it is in this moment: to empower you through understanding. Vox’s work is reaching more people than ever, but our distinctive brand of explanatory journalism takes resources — particularly during a pandemic and an economic downturn. Your financial contribution will not constitute a donation, but it will enable our staff to continue to offer free articles, videos, and podcasts at the quality and volume that this moment requires. Please consider making a contribution to Vox today.
Sourse: vox.com