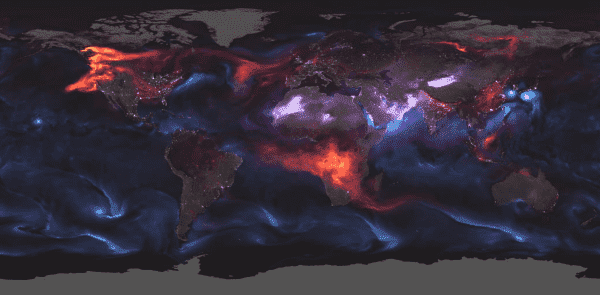
US’ National Aeronautics and Space Administration (NASA) released a glowing image last week showing a “mishmash of particles that dance and swirl through the atmosphere” ‒ all arising from weather phenomena and natural disasters happening here on Earth.
Officials created the map by piecing together information collected from various satellites including Terra, Aqua and Suomi NPP in order to “see” the particles, according to the agency. The Goddard Earth Observing System model was also used to create the image.

NASA releases image showing aerosol-related events around the world on August 23, 2018.
The map highlights multicolored particles known as atmospheric aerosols that come from dust (purple), black carbon soot from wildfires (red) and sea spray (blue). The map was created using information collected August 23, 2018.
“If you have ever watched smoke billowing from a wildfire, ash erupting from a volcano or dust blowing in the wind, you have seen aerosols,” NASA said in a statement. “On [Thursday], huge plumes of smoke drifted over North America and Africa, three different tropical cyclones churned in the Pacific Ocean, and large clouds of dust blew over deserts in Africa and Asia.”
Researchers were able to capture the particles from the raging California fires and Hurricane Lane as she began to approach Hawaii. Larger blue swirls from twin typhoons Soulik and Crimaron are also seen near South Korea and Japan.
The purple clouds across the Saharan desert, China’s Taklamakan Desert and the Desert of Oman suggested the area had undergone strong winds at the time, according to NASA. However, unlike the red blaze seen in the golden state, the red marked areas in Africa were deemed a “seasonal occurrence,” with officials citing agricultural burnings as the cause.
According to the space agency, aerosols, which can be both liquid and solid particles suspended in the air, can affect the Earth’s surface temperature “depending upon their size, type and location.”
Aside from showing aerosols, officials also used night light data captured by the Visible Infrared Imaging Radiometer Suite to outline different towns and cities.
Sourse: sputniknews.com


